
ELTRES in Agriculture
Development of a field water runoff quality monitor
With our partner at the National Institute for Agricultural Botany (NIAB) in Cambridge UK, Sony set out to develop a prototype to remotely monitor the quality of the water running off NIAB’s fields into the ditches criss-crossing its research farm in Cambridge.
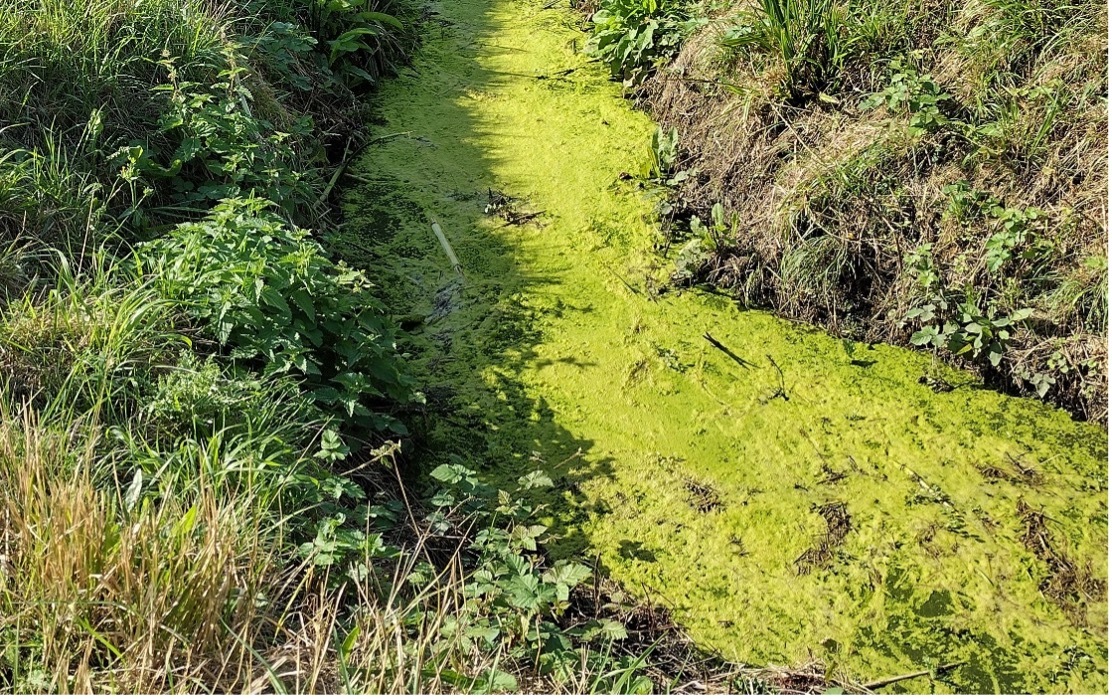
Different land management practices such as ploughing, using fertilisers or insecticides, together with the weather have a big impact on soil health and crop yields. This lack of visibility to the soil health has detrimental effects, for example, over-use of fertiliser costs the farmer money and has a negative impact on the wider environment (Figure 1).
However, if the quality of the water in the runoff ditches can be measured in real-time, we start to get visibility of the current soil health and can begin to plan farm activities in more optimal ways, for example avoiding excess use of fertilisers when the runoff water already indicates raised levels of agricultural related pollutants.
Why choose Sony ELTRES communications system for this water quality sensing application?
- Low power: the runoff water quality sensor, together with its communications system must keep running all through the growing season without intervention i.e. one battery charge.
- Reliable: not miss any of data sent from monitor(s) around the farm.
- Coverage: ability to place a water quality monitor in any of the ditches on the farm estate.
The Water Quality monitoring unit
As a first step in creating a field water quality monitor, a prototype was built. The approach taken was to select a few affordable water quality sensors on the market and then integrate those on a fast-to-develop platform, like Arduino, and then combine this with energy management components and an ELTRES transmitter module.
The selection of the microprocessor unit (MCU) development and ELTRES transmitter:
- Sony Spresense main board and extension board which together have good Arduino like compatibility along with low power consumption. In addition, for this prototype a custom ELTRES transmitter board, compatible with the Spresense main board’s miniature 100-way board-board connector, was used.
- As an alternative prototype, another Arduino compatible board, the ST Nucleo-64 combined with an ELTRES-DK development board and using the standard board-shield extension pins could also be used.
For the water quality sensors, the selection was mainly taken from DF-Robot’s sensor portfolio:
- Water depth and Water Temperature
- Water pH and Conductivity
- Water dissolved Oxygen level and turbidity (cloudiness)
- Conductive Rain sensor (various similar available on EBAY)
Mechanical construction of the combined unit
When putting all the sensors together, some of which require total immersion and others only partial, along with varying lengths of sensor cable, the conclusion was reached that a floating platform solution would be needed to mount all of the different sensors (Figure 2).
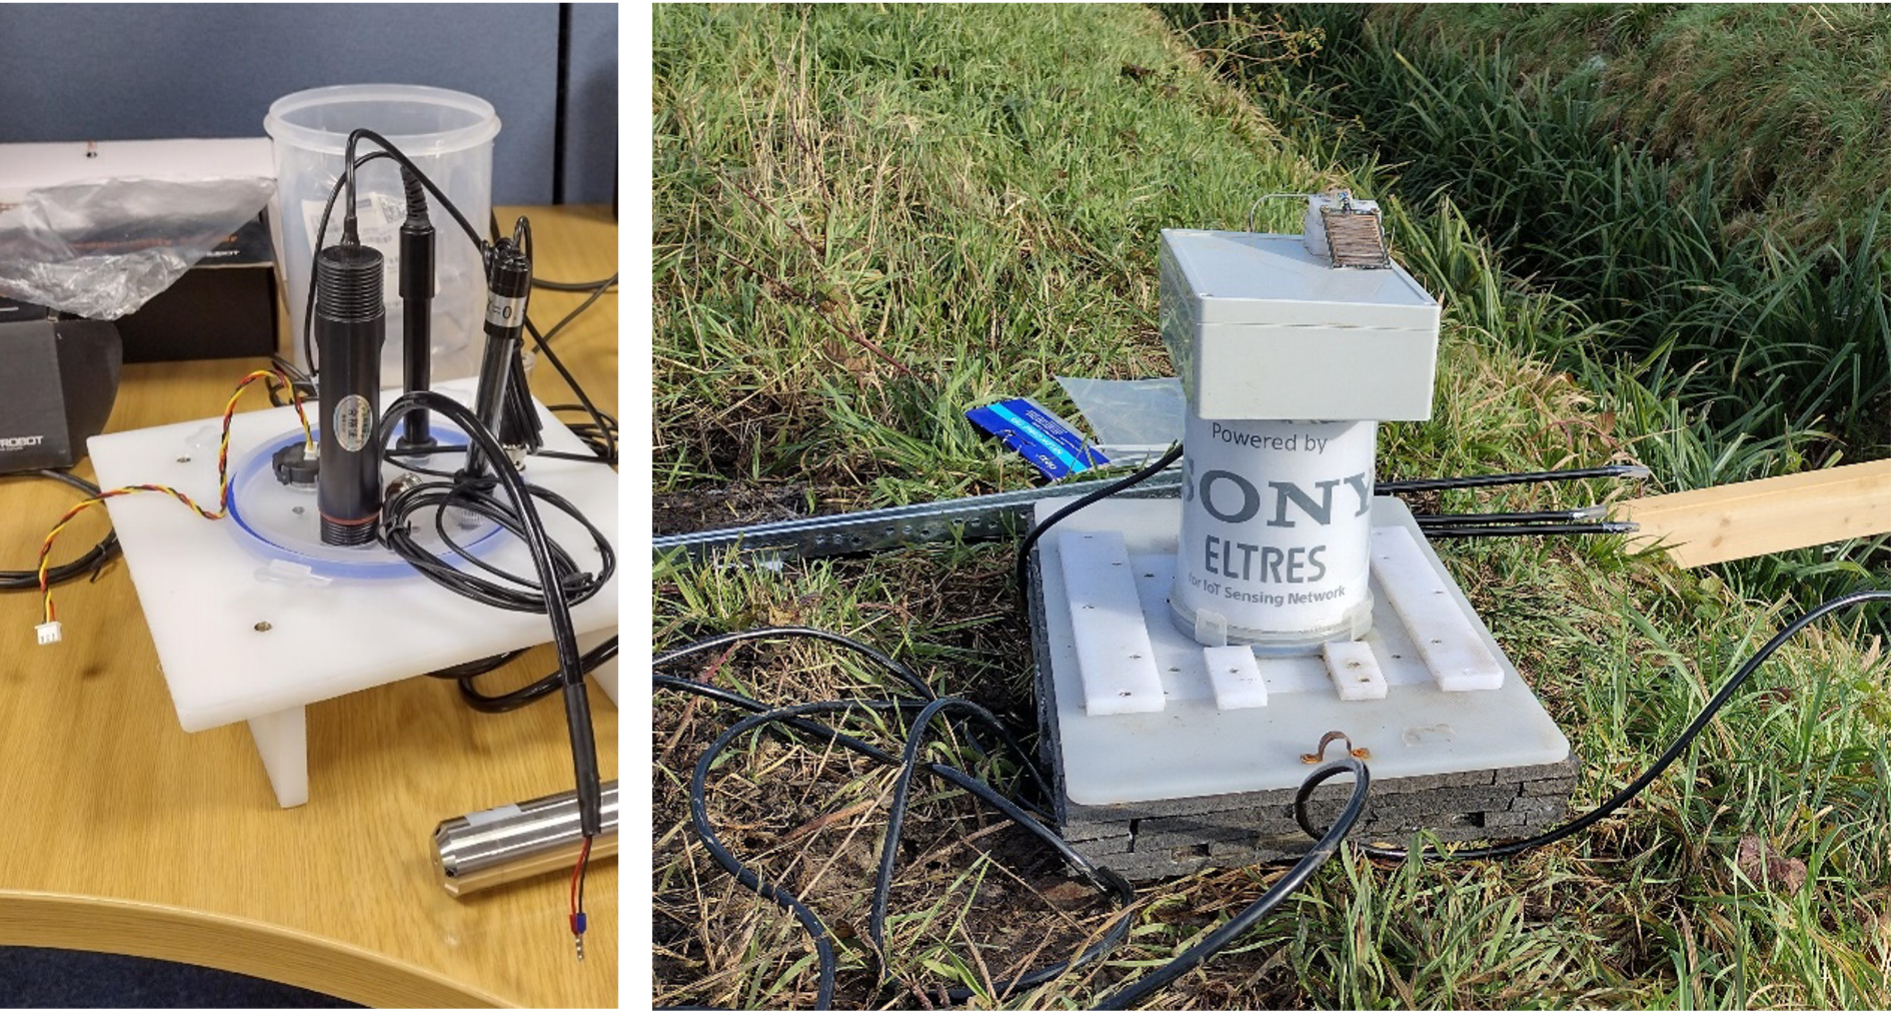
The base of the floating platform was made from an LDPE chopping board and this along with all of the sensors and associated electronics were kept buoyant through a lower base made from closed cell polyethylene, the same material as used in buoyancy aids.
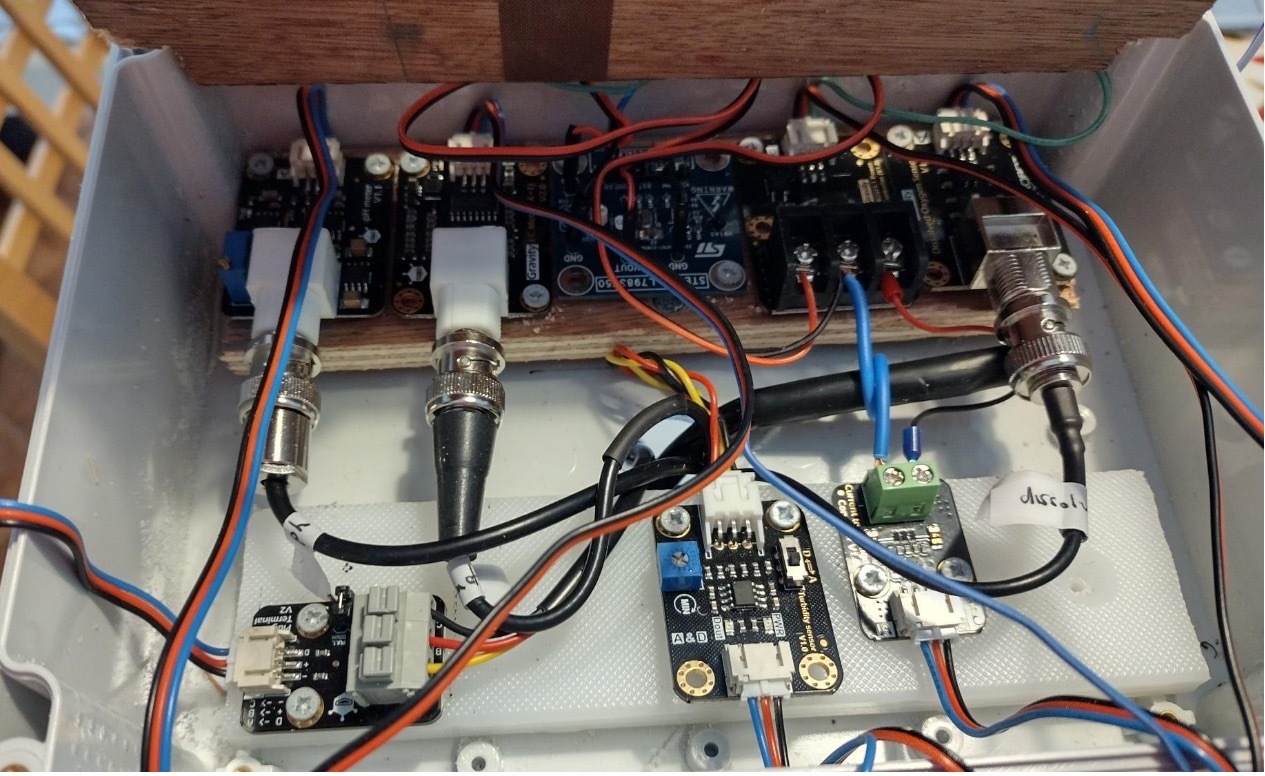
The middle section of the unit needs to protect the partially immersed sensors from water. A food storage container was used for this section. The top section contains the MCU, energy management and sensor converter boards and for this an IP65 protection plastic box was used, see Figure 3.
Electronics power management
The requirement was for the combined unit to last the whole growing season, so the power consumption of individual sensors, along with their stabilisation times was important.
Most sensors could be powered up and be ready to measure in a matter of seconds whereas others such as the dissolved O2 sensor could take up to 100 seconds. On the other hand, the quality and properties of the water do not generally change rapidly and NIAB had requested hourly measurement data. Therefore, it was decided to establish two power domains:
- Always on items: the MCU, very low power sensors including the slow start up time sensors
- Switchable power domain: for sensors with short start up times (less than 10 seconds)
This approach enabled power optimisation, with many sensors completely powered off for most of the time e.g. over 3500 seconds out of every 3600 seconds.
Embedded Software for the unit
Most of the water quality sensors employed had fairly simple interfaces or library code available to take measurements. Therefore, the main effort for the software was:
- Scheduling the cycle of events, powering sensors up/down and taking measurements
- Sanitising measurements, particularly eliminating out-of-range measures from processing
- Quantising the measurements from individual sensors and packing the payload data
- Passing the packed data to the ELTRES module to transmit
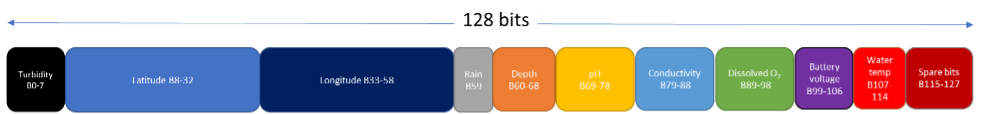
With ELTRES, each radio transmission can contain up to 128 bits of user payload data. This was sufficient, as even with 8 different sensing measurements, it was possible to send every sensor result each time in a transmission burst, as can be seen from the overall data packaging in Figure 4.
As ELTRES transmission modules have access to GNSS location without needing any additional GNSS chips, it was decided to allocate some payload bits to the latitude and longitude coordinates of the water quality runoff monitor. Thus, if the famer decided to move the monitor to a different area of the farm, then the location data in the payload will reflect the new location.
Within the payload, some sensor inputs used the analogue-digital converter input to the MCU, with 10 bits of data initially allocated for each measurement. However, after examining the expected range of variation for each sensor, along with the precision required, many of these ranges were compressed by quantisation e.g., to 8 bits width.
Once the data quantisation had been chosen, the final area of focus was to synchronise the low power clock states of the MCU unit with the transmission times of the ELTRES transmission module. This was possible as the ELTRES module was configured to generate a waking interrupt to the MCU 30 seconds ahead of when the next transmission burst needed to be ready to be sent. This gave sufficient time to warm up the water quality sensors and take multiple measurements.
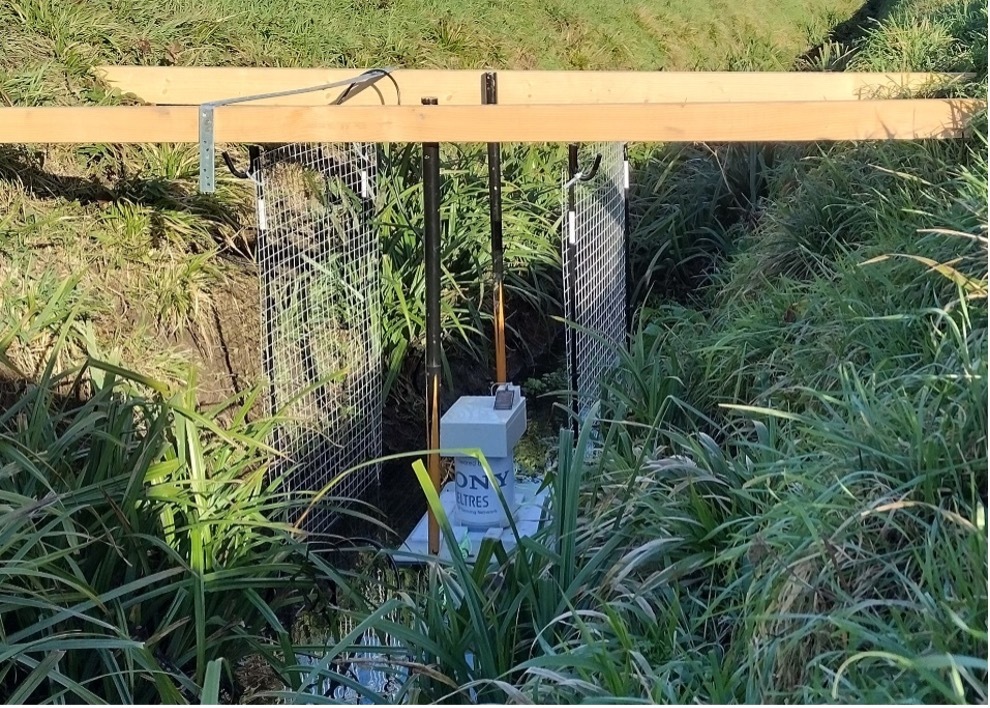
Field installation
The final installation to the deployment area was a little tricky as the field ditch banks were quite uneven. Whilst the runoff monitor needs to be able to float up during high rainfall periods, it must also be prevented from becoming caught on the uneven sides of the ditch. This was achieved by boxing in the monitoring unit with metal mesh guards as shown in Figure 5.
Results to date
The monitoring system has proven reliable so far, with sensor reports sent in every hour through day and night and through some of the coldest weather in January.
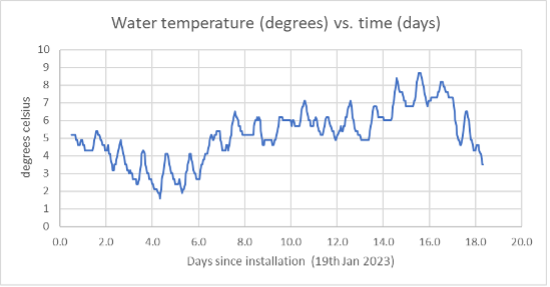
Figure 6 shows the variation in water temperature, measured on an hourly basis.
The turbidity sensor in the monitoring platform has showed a lot more variation over the initial monitoring period, see Figure 7.
- At the start, we have low (0) estimated turbidity reported and this is in-line with the physical observation of high visual clarity runoff water at the time of run off monitor installation.
- Briefly at 7 days and then again at 11 days after installation, the turbidity readings saturate to a maximum, 3000 NTU, indicating highly obscured water.
- Most likely this is the result of a piece of vegetation becoming wedged in the turbidity sensor.
- After 13 days, the turbidity level falls, and we are left with moderately turbid water quality.
- Has the vegetation has been washed away?
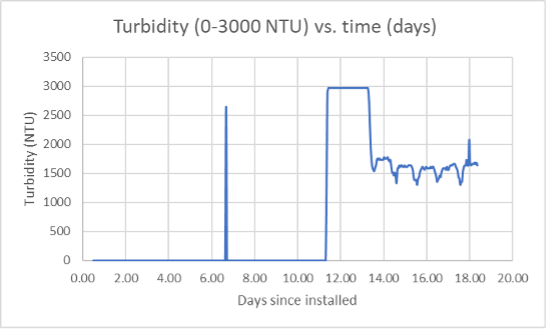
As a final note on turbidity, the transformation between the turbidity sensor analogue reading and the predicted turbidity has a temperature factor, is non-linear and also high gain in places. Thus, a small error in the starting offset can result in a big shift in the reported turbidity.
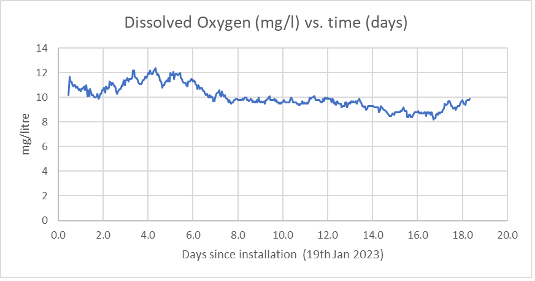
The initial reported dissolved O2 levels fall into a similar level as those of a freshwater river and are suggestive of good water quality, see Figure 8. Typically, the dissolved oxygen levels are seen to fall as the temperatures rise, and this is what we see in our measurements.
We look forward to seeing how the system performs over the growing season and especially how it responds following ploughing and other field management activities on the fields nearby.
Conclusion
We have developed a prototype field water runoff quality monitor paired with an ELTRES communication system.
The initial results from the runoff monitor look promising, but further monitoring and observation are required to assess if the different water quality sensors can provide data which is resistant to long term drift and also accurate enough to clearly identify changes caused by farm management practices. Volatility in the water turbidity reading suggest that sensor screening should be a point of study for an enhanced prototype.
The runoff monitor’s communication system has worked reliably in a farm setting, demonstrating the suitability of the ELTRES radio system for use in agricultural situations, where it is able to provide radio coverage across a large farm area.
We have also shown how simple it can be to develop a bespoke water monitoring sensor using ELTRES powered communications modules.
Contact Us
For inquiries about Sony Semiconductor Solutions Group and products / solutions, specifications, quotation / purchase requests, etc., please contact us using the Inquiry form from the button below.